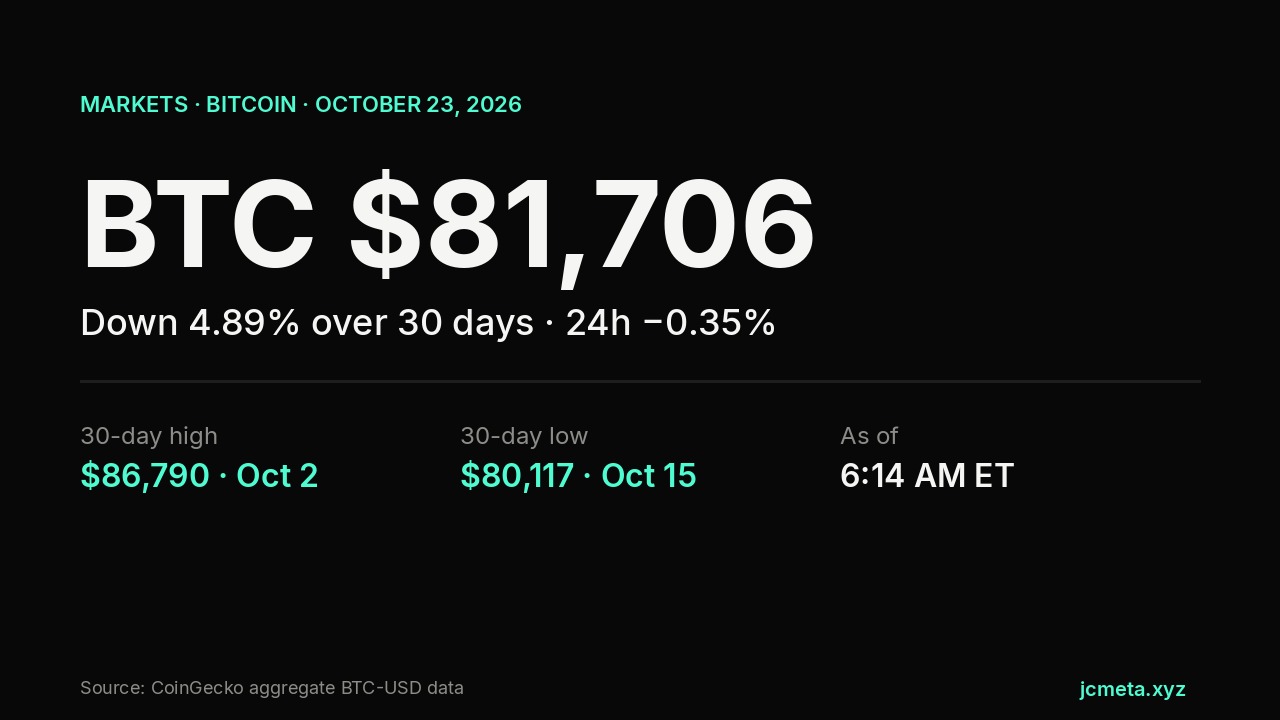
Bitcoin changed hands at $81,706 at 6:14 AM ET on Friday, according to CoinGecko’s aggregate BTC-USD price. That is 0.35% below the level 24 hours earlier and 4.89% below where it stood 30 days ago.
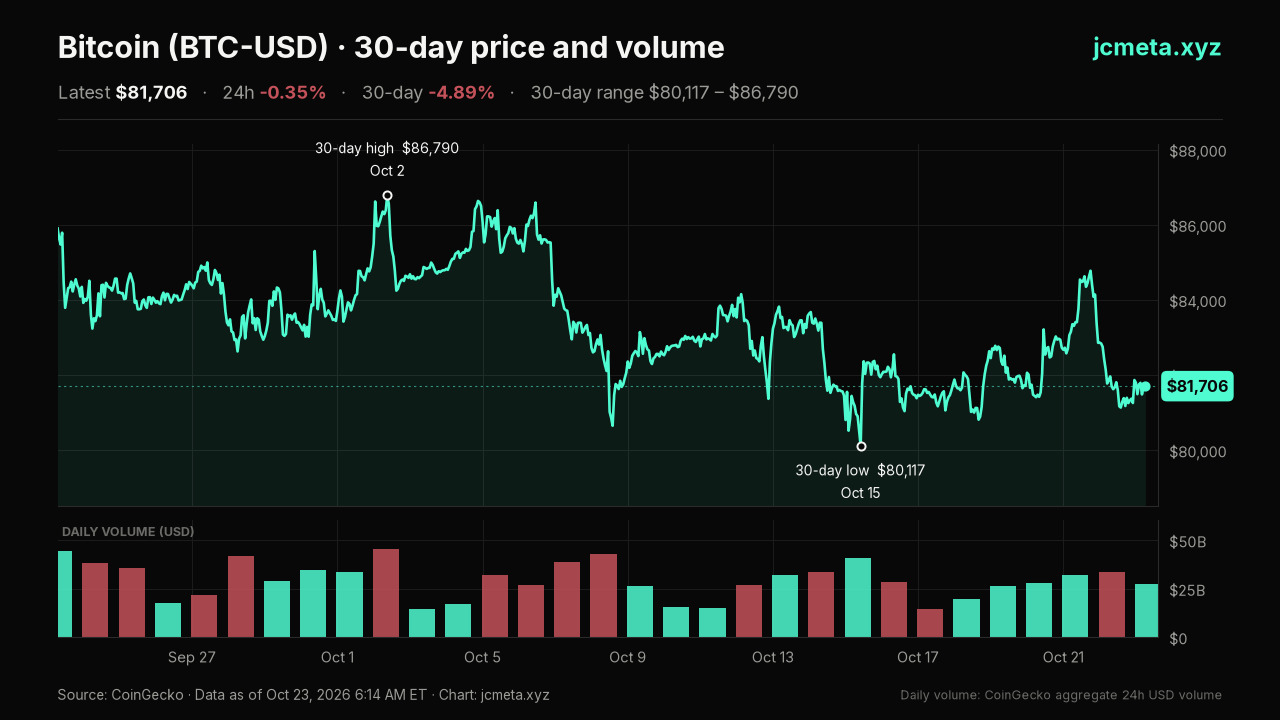
The overnight range was narrow. CoinGecko listed a 24-hour high of $81,965 and a low of $80,989 shortly after 6:15 AM ET, with about $26.5 billion in reported 24-hour trading volume.
The bigger number came from the fund side. US spot Bitcoin ETFs recorded a $635.6 million net outflow on Thursday, October 22, according to Farside Investors. BlackRock’s IBIT lost $254.1 million and Fidelity’s FBTC $217.5 million.
That followed a $524.8 million inflow on Wednesday. Over the four trading days from October 19 through October 22, the funds are still up a net $439.1 million.
Key takeaways
- CoinGecko: $81,706 at 6:14 AM ET on October 23; down 4.89% over 30 days.
- Spot Bitcoin ETFs: $635.6 million net outflow on October 22, per Farside.
- 30-day range: $80,117 (October 15) to $86,790 (October 2).
Why did Bitcoin ETFs see $635 million in outflows on October 22?
Redemptions were broad. ARK’s ARKB gave back $109.4 million, Bitwise’s BITB $27.4 million and Grayscale’s GBTC $29.5 million. Morgan Stanley’s MSBT was the only fund with a gain, at $2.3 million.
The selling coincided with a weak day for US tech stocks. CryptoWatchDesk’s ETF coverage noted the Nasdaq fell 2.6% on Thursday, and Bitcoin dipped toward $80,800 on Kraken during the US afternoon.
Price has held up better than the flow figure suggests. Bitcoin is roughly $1,600 above its October 15 low on the same CoinGecko series, and the seven-day change is just -0.27%.
Supply context is unchanged: about 20.10 million BTC in circulation and a market value near $1.64 trillion, per CoinGecko. The October 22 CoinDesk index print discussed in yesterday’s markets note was $82,469; index and aggregator levels differ slightly by methodology.
What to watch next
Friday’s Farside table will show whether Thursday’s redemptions were a one-day reversal or the start of a run. On price, $80,117 is the nearest marked level on the 30-day chart. A daily close below it would set a new 30-day low on this data set.