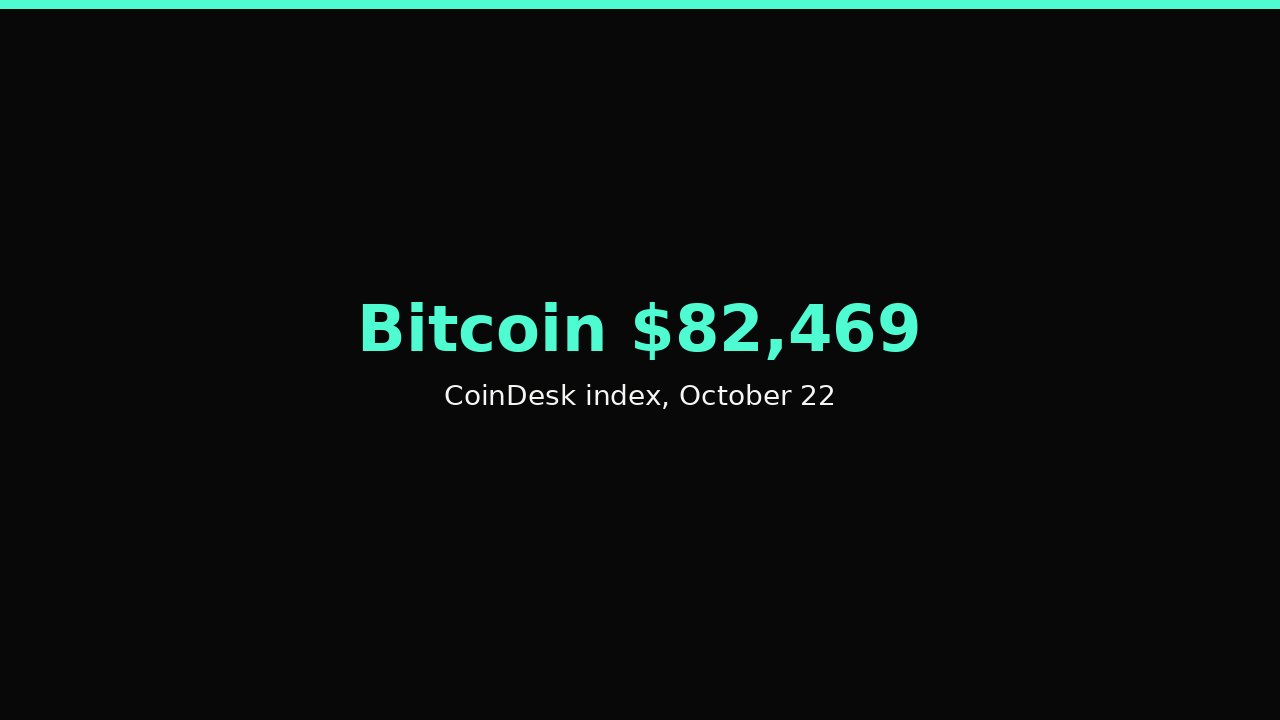
The CoinDesk Bitcoin Price Index listed Bitcoin near $82,469 on October 22, according to MarketWatch’s last update early that day. The print sat about 2.4 percent below the prior close of $84,464.
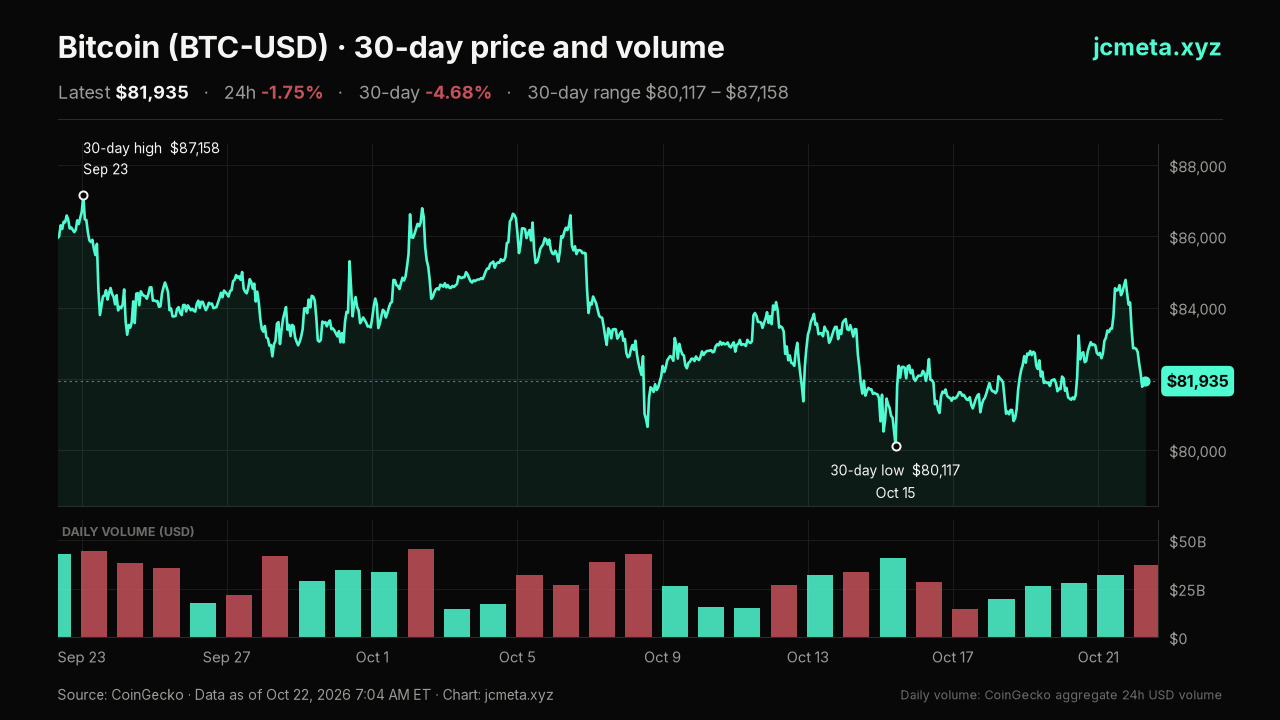
Day range on the index ran from roughly $82,456 to $84,780. Circulating supply remained near 20.10 million BTC. Fully diluted value stayed in the low $1.7 trillion range on major aggregators.
The session continued the pattern of moves inside the low-to-mid $80,000s that has held since mid-October. No large corporate treasury purchase or ETF flow print accompanied the morning reading.
Key takeaways
- CoinDesk Bitcoin Price Index near $82,469 on October 22.
- Prior close $84,464; day range approximately $82,456–$84,780.
- Circulating supply near 20.10 million BTC.
What does the $82,469 CoinDesk reading show?
The index has spent most of the past week between $81,000 and $84,500. The October 21 close near $84,464 marked the high end of that band before the overnight pullback.
Volume across major venues stayed consistent with recent sessions. ETF flow data for October 21, when available, will be the next external figure traders check against the price level.
Background on prior daily prints appears in the October 21 ETF note and the October 20 aggregator reading.
What to watch next
The US close on October 22 and the next Farside Investors flow table will show whether the $82,000–$83,000 area holds or whether redemptions resume after the two positive sessions earlier in the week.