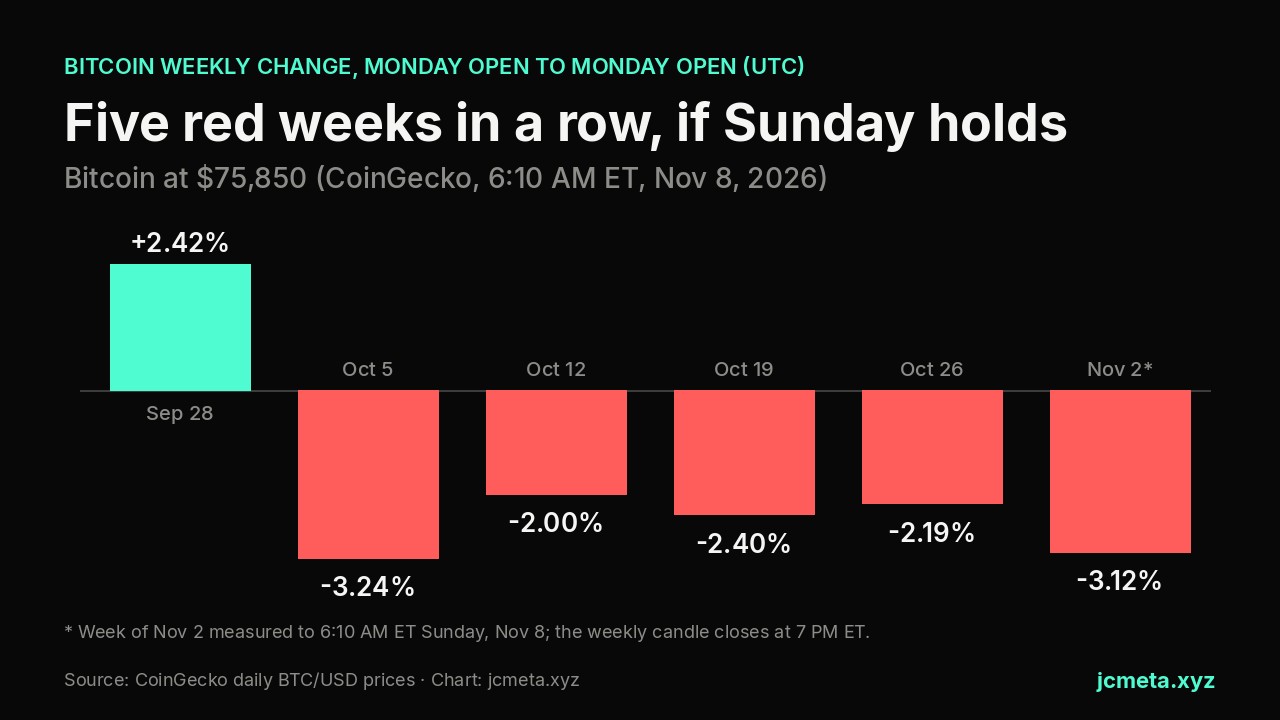
Bitcoin is heading into Sunday's weekly close with a losing streak on the line. CoinGecko had the price at $75,850 at 6:10 AM ET on November 8, down 0.09% over 24 hours and 8.77% over 30 days. Over the past day it moved inside a band of only about $300, between roughly $75,625 and $75,922.
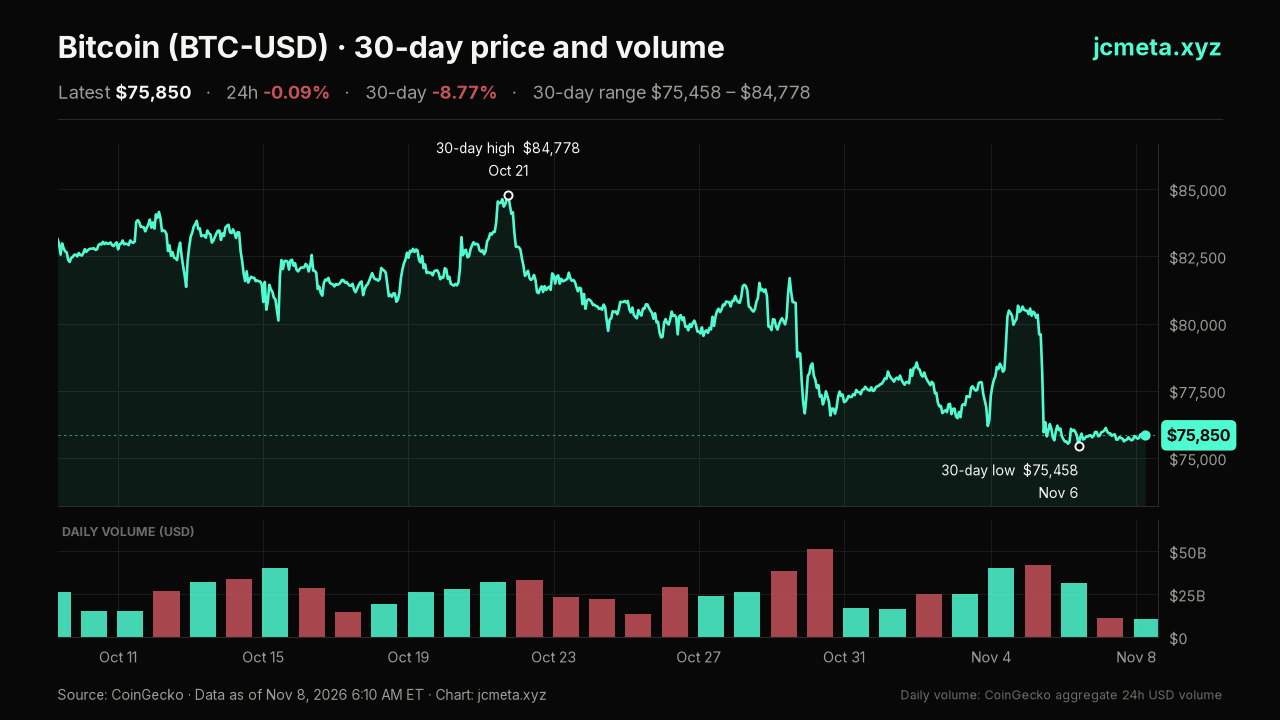
The chart shows how far the month has slipped. Bitcoin peaked near $84,778 on October 21 and touched its 30-day low of about $75,458 on November 6. Sunday morning's price sits less than $400 above that low.
Is bitcoin on track for a fifth losing week?
Yes. Bitcoin traded at $75,850 at 6:10 AM ET on Sunday, November 8, 2026, about 3.1% below its $78,294 open on Monday, November 2, according to CoinGecko. A weekly close below that level would make it five straight down weeks, starting with the week of October 5.
The four completed weeks before this one all ended lower on CoinGecko's daily prices: down 3.24% for the week of October 5, 2.00% for October 12, 2.40% for October 19 and 2.19% for October 26. From the October 5 open near $86,490, bitcoin has given up about 12.3%. The weekly candle closes at 7 PM ET Sunday, which is midnight UTC.
A fifth red week would put the run among bitcoin's longest. CoinDesk analyst James Van Straten noted that only two streaks ran longer, six weeks at the start of 2026 and nine weeks in 2022, as CryptoScan24 summarized on Saturday.
Key takeaways
- CoinGecko had bitcoin at $75,850 at 6:10 AM ET on November 8, 2026, down 8.77% over 30 days.
- Bitcoin is about 3.1% below its $78,294 weekly open, after four straight down weeks since October 5.
- The Crypto Fear & Greed Index read 25 on November 7 and 28 on November 8.
Why the selling has stalled, not reversed
Sentiment is still low. The Crypto Fear & Greed Index read 25, or extreme fear, on Saturday and edged up to 28 on Sunday. It was 50 as recently as Thursday.
Friday's stock rebound did not carry over. The Nasdaq rose 1.09% to 24,579.42 on November 6 while bitcoin's daily candle on Binance closed lower, according to CryptoScan24. Institutional demand also stayed soft: U.S. spot bitcoin ETFs saw $411.9 million in net outflows on Friday, per Farside Investors, capping the week we covered in Saturday's ETF report.
Macro data added pressure. The October U.S. jobs report showed 165,000 jobs added against a forecast of about 65,000, with unemployment at 4.1%, a result an analyst quoted by The Economic Times said may reduce expectations for near-term rate cuts.
What to watch next
The first marker is the 7 PM ET weekly close against the $78,294 open. After that, Monday's ETF flow data will show whether the redemptions that dominated last week have slowed, and the November 6 low near $75,458 is the level that defines the 30-day range.