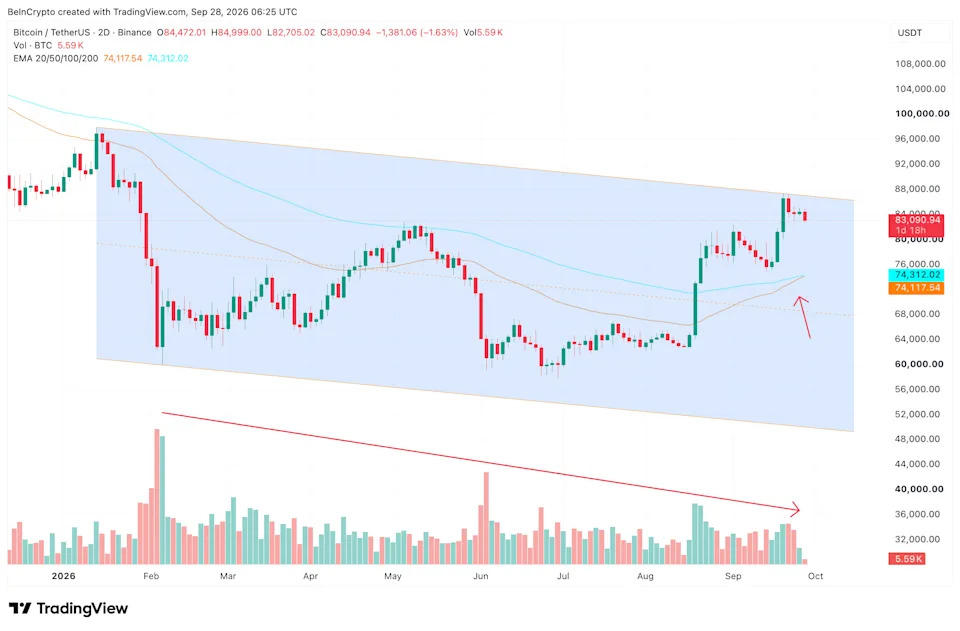
OKX’s historical table for October 14 showed Bitcoin opening at $83,430.60, reaching a high of $84,147.10, and closing at $83,201.90. The low printed at $82,956.30 on volume of $265.63 million. MyTrade Academy listed a live figure near $83,259, down 0.41% over 24 hours.
MarketWatch’s CoinDesk Bitcoin Price Index sat near $83,744 early in the session with a day range of roughly $83,072 to $84,039. Yahoo Finance showed a close near $83,073. The cluster keeps the asset inside the range that formed after the October 8 low near $80,300 and below the early-month highs above $86,000.
Cross-checks on Investing.com and BitKan produced readings within a few hundred dollars of the OKX close. No major ETF flow print for Tuesday had published at the time of writing. The asset remains roughly 34% below its October 2025 all-time high near $126,080.
Key takeaways
- OKX October 14 close: $83,201.90 after open of $83,430.60.
- Session high $84,147.10 and low $82,956.30.
- Holds above the October 8 low near $80,300; still below early-October peaks.
How the $83,201 close compares with Monday’s recovery
Monday’s session had recovered from an overnight dip near $81,034 to close higher near $83,430 on several feeds. Tuesday’s OKX print gave back part of that gain without testing the lower end of the recent band. Support on daily data remains the October 8 low. A move above $84,200 would return the index to levels last seen earlier in the month.
Inflation data later in the week will update the rate path that has weighed on risk assets. Spot ETF flows for the prior week still showed net outflows; Tuesday’s table will show whether the pattern continued.
What to watch next
The next ETF flow release will clarify whether Tuesday extended or reversed recent withdrawals. On price, a break under $82,700 would retest the lower end of the current range while a hold above $83,200 keeps the recovery from Monday’s low intact.