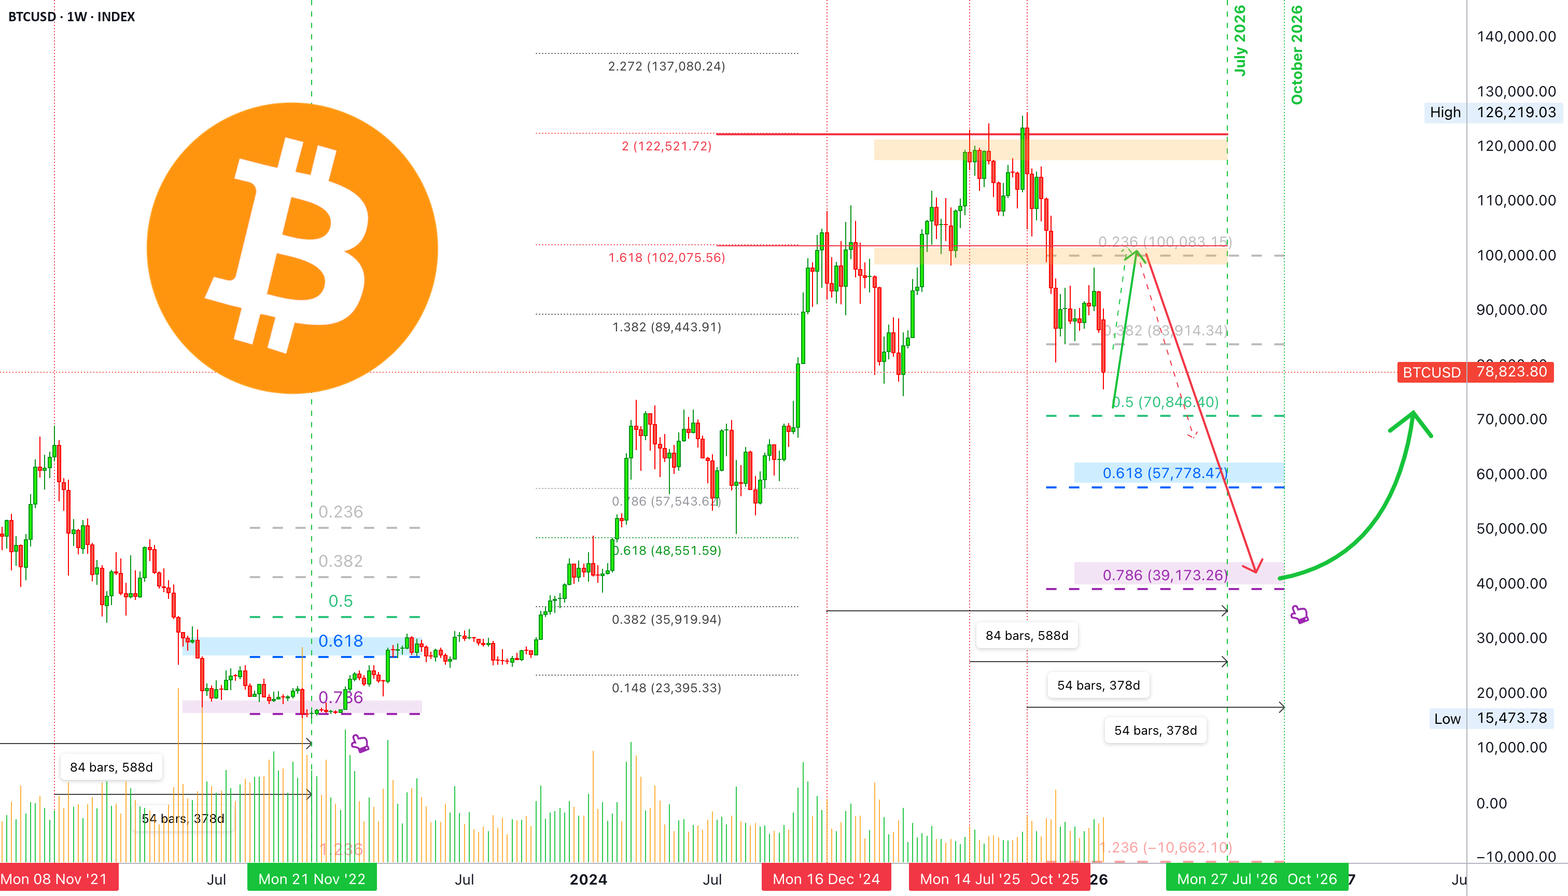
CoinDesk's Bitcoin Price Index (XBX) showed $82,753 at 6:11 a.m. EDT on October 10, up $502, or 0.61%, from a previous close of $82,251. The morning print sits above Friday's close and below the levels that opened the week near $85,000.
MarketWatch's page listed the day's range early Saturday near $82,500 to $82,900 on some feeds. OKX history put the October 10 session open near $82,871 with a high of $83,014. The index remains more than 34% below the October 6, 2025 all-time high of roughly $126,200.
Oil prices and expectations around the October 27-28 Federal Reserve meeting continue to shape the backdrop. Brent crude traded near $100-105 in recent sessions. Markets still price an unchanged rate at the next meeting, with a possible hike later in the year. Spot Bitcoin ETF flow data for the latest published day still reflected outflows in the hundreds of millions from the prior session.
Key takeaways
- CoinDesk XBX: $82,753 at 6:11 a.m. EDT on October 10, up 0.61% from $82,251 close.
- The print stays inside the week's range after Thursday's low near $80,300.
- Weekly decline near 3% after the index traded above $87,000 earlier in the period.
What the $82,753 XBX print means after Friday's close
The index recovered part of Thursday's drop but has not reclaimed the October 7 close near $83,400. That leaves the morning figure as a modest bounce inside an already-traded band. Different indexes (OKX, Investing.com, Coinbase) printed similar levels between $82,500 and $82,900, confirming the XBX reading is not an outlier.
ETF outflows published for Wednesday and Thursday totaled roughly $700-900 million across the two days on Farside-based trackers. Those figures lag the price by one session. The 30-day net for U.S. spot Bitcoin funds remained positive in the most recent snapshots, even as single-day withdrawals drew attention.
What to watch next
The next published ETF table will show whether Friday's session extended the outflow or reversed it. On price, the October 8 low near $80,300 remains the nearest clear support on the recent MarketWatch series, while $83,400 marks the prior close the index has not yet retaken. September CPI and PPI prints next week will update the rate outlook that has pressured risk assets this month.